
User Journey Report
Moody Month App
Image via Dazed.com
Skills & Competencies
User Journey Mapping
Usability Analysis
Heuristic Evaluation
UX Research & Synthesis
Information Organization
Critical Thinking
Visual Communication
About This Project
This project evaluated the usability of the Moody Month mobile app, which helps users track emotional and physical health patterns. The goal was to assess how effectively the app supports symptom tracking, navigation, and overall user flow. Using journey mapping and heuristic analysis, I identified points of friction and offered design recommendations to make the experience more intuitive and user-centered.
Context & Purpose
This project examined the Moody Month app to understand how users navigate its tracking features and interpret emotional and physical health data.
The app’s multi-layered interface made it a useful case for evaluating clarity, flow, and interaction design in wellness technology.
Purpose:
- Map the end-to-end user journey for symptom tracking.
- Identify usability issues affecting navigation and engagement.
- Apply usability heuristics to assess layout, consistency, and feedback.
- Recommend design improvements to streamline the user experience.
Process & Methods
I used task-based usability testing and journey mapping to evaluate how the Moody Month app helps users interpret patterns in their mood and symptom data. The goal was to observe real user behavior, identify friction points, and connect findings to established usability principles.
The process focused on understanding how design and information hierarchy affect user comprehension and engagement when reviewing tracked data.
Steps:
- Developed a task scenario where a participant attempted to analyze migraine patterns in relation to hormonal phases using the app’s “Trends” feature.
- Conducted a usability test session using a think-aloud method to capture real-time thoughts, confusion, and frustration points.
- Created a user journey map to visualize each step, emotion, and pain point throughout the experience.
- Referenced Nielsen’s heuristics during analysis to frame usability issues—particularly around visibility of information, feedback, and recognition versus recall.
- Synthesized findings into actionable recommendations that enhance clarity, feedback, and data interpretation within the app.
Findings
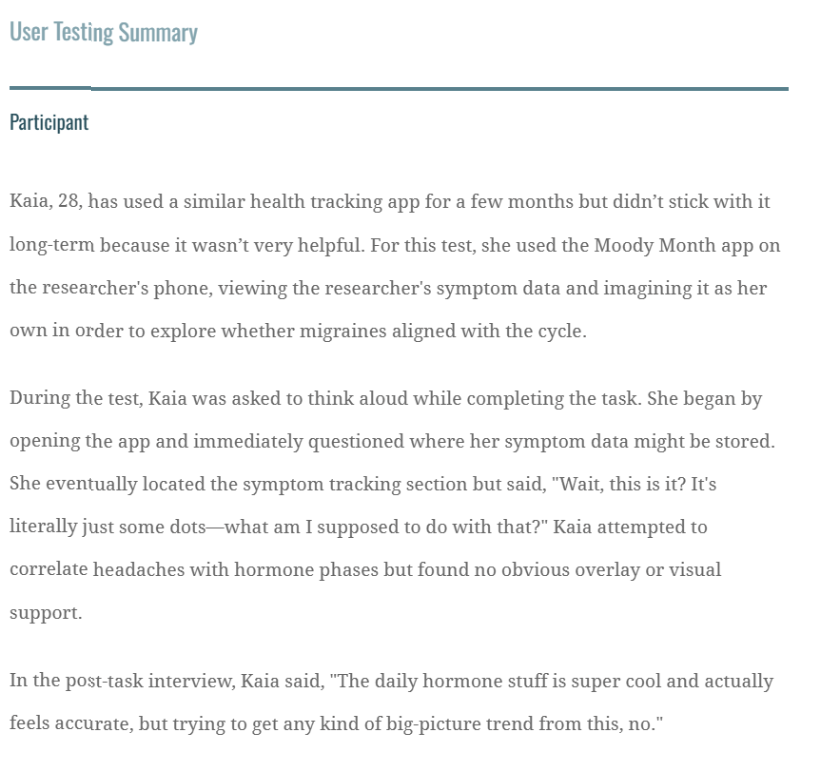
The usability test revealed several barriers that prevented users from easily analyzing their symptom data in the Moody Month app.
While daily insights were engaging and visually appealing, users struggled to identify long-term trends or understand how their tracked symptoms related to hormonal phases.
Key Findings:
- Limited trend visibility made it difficult for users to recognize patterns between symptoms and hormonal cycles.
- Minimal feedback cues left participants unsure whether actions—like logging or viewing symptoms—had saved or updated correctly.
- Lack of contextual data forced users to interpret graphs manually without overlays showing hormone phases or cycle timing.
- Cognitive overload occurred when users tried to correlate data points without visual or textual guidance.
- Unclear purpose of data views caused confusion between “Trends” and “Current Cycle,” leading to frustration and disengagement.
Insights:
- Integrating cycle overlays and summary insights would help users make sense of long-term data without needing to interpret raw graphs.
- Adding interactive feedback and contextual explanations could increase confidence and understanding when reviewing health patterns.
- Overall, users needed a clearer bridge between data visualization and personal meaning, allowing the app to fulfill its goal as an empowering wellness tool.
Image via Forbes.com
Recommendations
The report proposed targeted updates to improve clarity, reduce friction, and strengthen the overall tracking experience in the Moody Month app.
01
Introduce AI-Powered Insights
Add a feature that allows users to ask natural language questions such as, "How do my migraines align with my cycle?" This would help users quickly identify meaningful trends without needing to interpret graphs manually. This aligns with Nielsen's heuristic of minimizing the user's memory load and providing informative feedback.
02
Overlay Symptoms with Cycle Phases
Implement a scrollable timeline or chart that overlays tracked symptoms with cycle phases (e.g., follicular, luteal) and hormone forecasts. This would improve recognition and visual clarity, helping users draw actionable conclusions.
03
Add Summarized Insights Post-Cycle
Provide users with a cycle summary that includes insights like, "You logged headaches on 5 of 6 luteal phases." This feedback loop would enhance the app’s utility and foster trust in the data being tracked.
04
Refine Visual Hierarchy
Important mood and symptom summaries competed for attention with secondary content. Adjusting spacing, color emphasis, and typography would guide users more effectively toward key insights.
Reflection
This project emphasized how visual hierarchy and feedback directly shape user confidence in wellness apps.
Mapping the user journey made it clear that even small inconsistencies in labeling or navigation can interrupt engagement and weaken trust.
The recommendations focused on creating a smoother, more transparent experience—one that supports users in tracking their health without distraction or uncertainty.
Image via MoodyMonth.com
Related Projects